I have made some considerable efforts to become proficient with Google Analytics. It’s a very powerful and extensive system. The information that can be provided to web site owners via Google Analytics tracking and reporting is valuable and interesting. In addition to going through several texts, I have completed two separate online Google Analytics training courses. The courses were offered directly by Google and were very informative. They provided a nice certificate of completion for each course.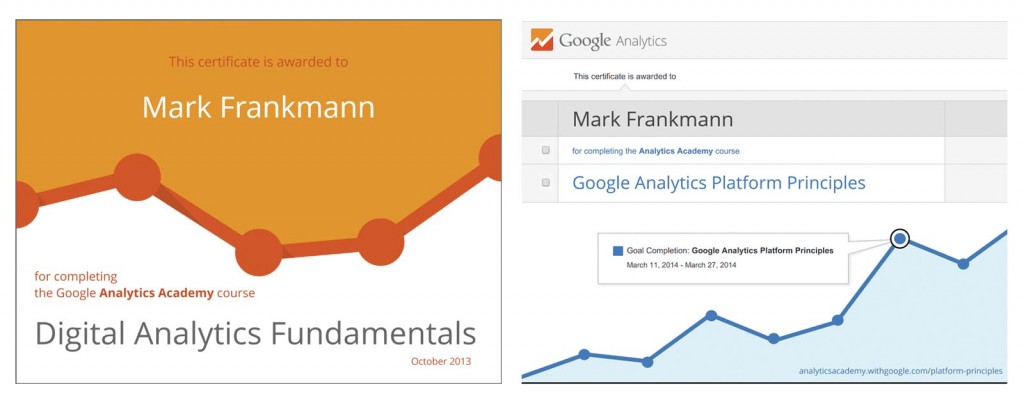 I have set up and continue to provide Google Analytics tracking and automated reporting for more than a dozen web sites to date. These sites cover a wide range of business and organization types. The So Inclined, Stephen B. Johnson Law Firm, McNeals Auto Repair, Grayhead HOA, and others all receive a monthly Google Analytics report from Open Range Imaging.
These websites use a custom Google Analytics dashboard that I provide. This dashboard generates and manages the monthly reports I provide. The reports deliver understandable information regarding the key areas of web site visitor statistics, as defined by Google Analytics.
AUDIENCE. How ma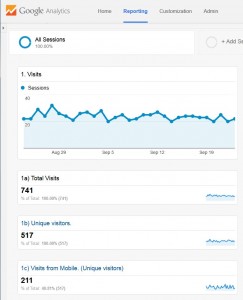 ny visitors per day access your site? How many of those are unique visitors versus multiple site visits from one person? How many visitors are accessing via mobile networks? This section of the report provides those stats.
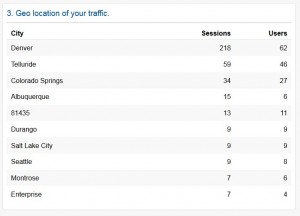
Where were these visitors located. What City, State or Country are your site visitors coming from? Does this correspond with any of your marketing efforts? Geographic Location of visitors provides good insight into this.
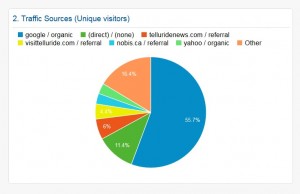 ACQUISITION. How did the site visitors find your site?Did they click on a link in an online advertisement you placed? Did they search on Google, type your site address directly into the browser, click a link to your site on facebook or…?
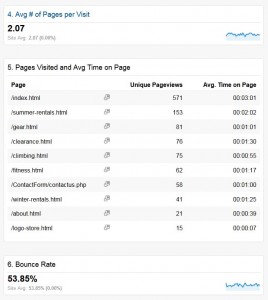
BEHAVIOR. How many pages were visited on average. Which pages were viewed the most and how long was the average time spent on each page? Which parts of your site do people find the most interesting? These are good indicators of site visitor engagement.
Bounce Rate is a bit of broad brush generalization. The Bounce Rate Metric in Google Analytics is the percentage of single-page visits to total visits. A high Bounce Rate typically indicates that a visitor did not find the page they landed on relevant to their interests and they exited the site. This is not always the case. If your blog is being tracked by Google Analytics and a visitor lands on one of your blog posts and the information they seek is clearly available, they may have no further interest in diving deeper into your website. Typical bounce rates range from 40% to 60%. Digging deeper into the tracking data can reveal that a large percentage of bounces may come from one source.
All of these key performance indicators are combined into a PDF and e-mailed to each site owner on the first of every month.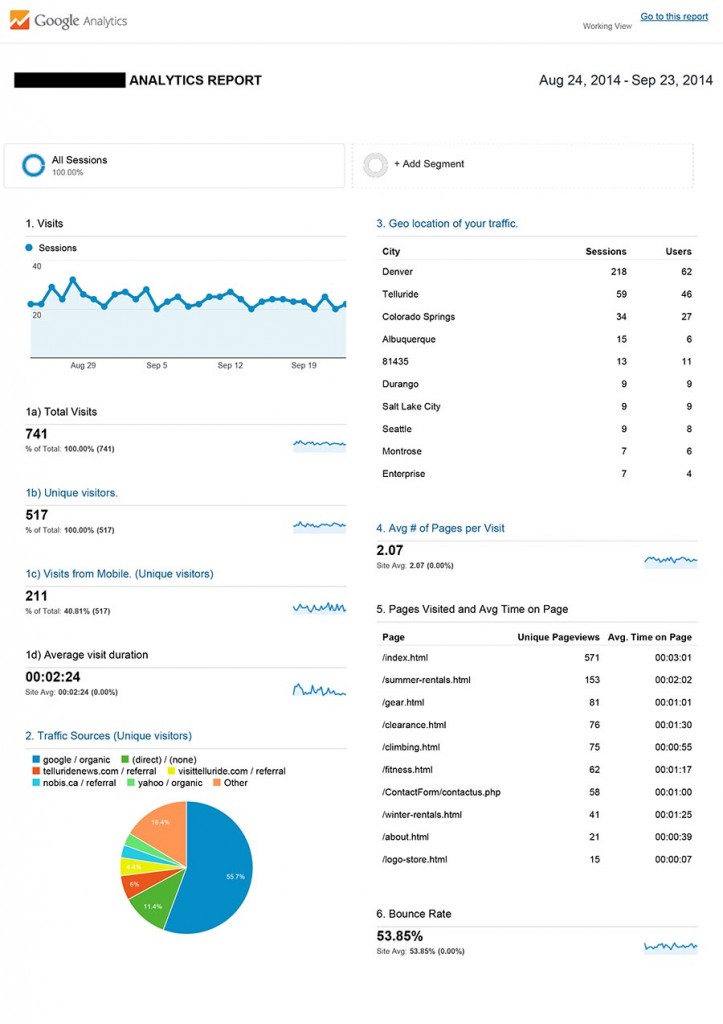
Reporting for any site with specific needs beyond the standard report is available. An example is a site I developed for Tommytyme.com. This is a one page “portal” site with buttons that take the visitor to the Tommytyme Amazon storefront, Ebay storefront or social media affiliate page. I customized the Tommytyme Google Analytics Report to provide info on how many times each button is clicked. This could be further defined to provide information regarding the Acquisition stats for each button. This is called Event Tracking.
Google Analytics is a very powerful system. It provides access to thousands of reports and comparisons and can be overwhelming. The custom reports I provide present the key metrics in a easily readable and understandable format. If more detailed reporting is needed it can be added.


